
Managing a field service business can be complex, with many factors and components that affect your company’s success. There’s no shortage of data to track that can help you make sense of it all — from the time it takes to get to job sites to the number of times technicians attach service contracts. This data can tell you what’s going well and what’s not, pointing you in the right direction for overall improvement.
What Metrics Can You Track in Field Service?
Often falling under the category of key performance indicators (KPIs), field service metrics are quantitative measurements of a specific aspect of the business. These concrete numbers are easy to track and allow you to gauge performance with concise, at-a-glance information.
Here are some field service management metrics to consider tracking for your organization:

1. Time to Site
The idea of “time to site” reflects how long it takes technicians to reach the job site from when they’re dispatched for immediate-response calls. A low number here means routes are efficient — workers spend less time driving and more time working on the issue.
If the number is higher than you’d like, consider using GPS to inform your dispatching. See exactly where your technicians are and identify faster, shorter routes. If traffic backs up, dispatchers can intervene and suggest alternate routes. Additionally, you can keep an eye on employee movements and make sure they’re working efficiently. This KPI is also affected by general inefficiencies, such as stopping at the warehouse for a part.
Managing said issues with better visibility can help reduce time to site.
2. Time to Complete
A similar metric to time to site, the mean time to complete looks at the end-to-end efficiency of your processes. This is a very comprehensive KPI, so it should be used in conjunction with others to help you narrow down what is influencing it.
If your time to complete is high, it could be due to factors like:
- Inefficient scheduling practices.
- Slow billing procedures.
- Long repair times.
- Slow estimating and bidding processes.
This metric is broader and reflects poor efficiency and longer wait times, which can affect profitability and customer satisfaction.
3. First-Time Fix Rates
The first-time fix rate tells you how many jobs are completed on the first visit. Not every job can be fixed in one go, but it’s still a good indicator of general efficiency and customer satisfaction.
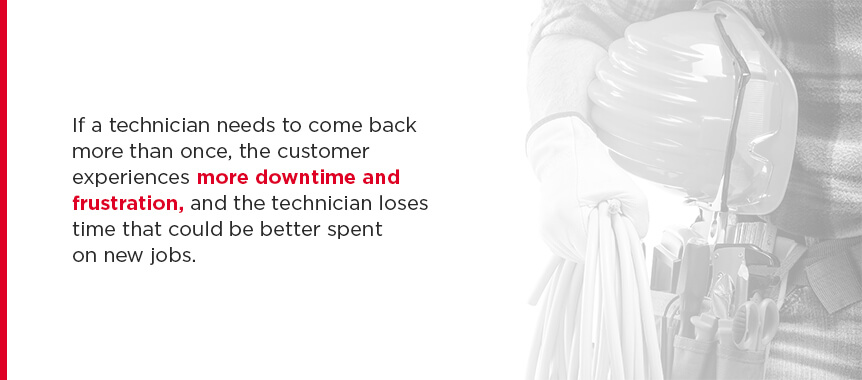
If a technician needs to come back more than once, the customer experiences more downtime and frustration, and the technician loses time that could be better spent on new jobs.
A low first-time fix rate can come from problems like:
- Incorrect or incomplete diagnosis of the problem.
- Inadequate technician skill.
- Scheduling errors and inefficiency.
- A lack of parts on-hand.
- Communication oversights.
Many of the above problems can be addressed with a good field service management platform. Bring first-time fix rates up by offering employees in-field access to resources like equipment histories, communication tools or documents uploaded to a service management platform. These documents might cover technical guides or checklists to help them complete a full assessment.
A service management tool can also help with smarter scheduling and identifying parts a technician will likely need before they leave the warehouse.
4. Contract Attach Rate
Often, your technicians are also your salespeople. A contract attach rate can tell you how often and how effectively technicians are attaching service contracts to their visits. If the number is low, they may not be upselling very well, which can affect profits and job frequency. This situation can also negatively impact customer relations.
To boost a low attach rate, spend some time training technicians and revisiting your offerings. Technicians should be knowledgeable on the plans and know how to sell them. Consider offering incentives, like bonuses, for higher sales numbers.
The plans themselves need to be worthwhile, too. Be sure to assess your service plans and make sure they contain services customers actually want.
5. Contract Uptime
The contract uptime is a percentage of how often a piece of equipment under a maintenance contract is operational. If the number is low, take a look at the following factors:
- Installation practices: Is installation as comprehensive as it could be? Are technicians missing steps that cause problems later?
- Product quality: Are you using low-quality products that are costing you more in the long run?
- Maintenance terms: Is your maintenance term simply too long and covering typical problems associated with aging equipment?
A low uptime hurts customer satisfaction since they’re experiencing more interruptions, whether you’re working with a residential heater or business-critical industrial equipment. More contract services also affect your profitability because technicians spend more time on unbillable work covered by the contract.
To boost uptime, gather more data about what’s affecting it — you may need to tweak your processes, switch suppliers or adjust your contracts. Another option is to implement or improve maintenance programs so you can avoid downtime entirely.
6. Jobs Per Day
This is another crucial metric to follow when you’re tracking efficiency. The jobs per day metric is typically affected by time to site and reflects how many jobs your technicians average each day.
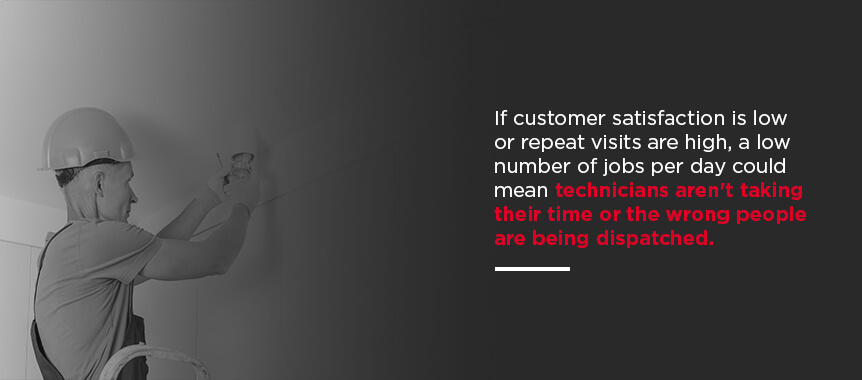
Of course, a higher number here means you’re clocking more jobs in less time. If customer satisfaction is low or repeat visits are high, a low number of jobs per day could mean technicians aren’t taking their time or the wrong people are being dispatched. Another cause for a low number could be inefficient travel.
With high visibility in your service or work order calendar, managers get an overarching view of assignments. Then, they can better monitor employee patterns and assign the best people to the jobs.
If your jobs per day are low, you might look more closely into your scheduling and find that your technicians aren’t being utilized according to their skillsets. A technician who’s an expert in a certain topic can get the job done much faster and more completely than someone who isn’t very knowledgeable on the equipment.
Another possibility is that employees are spending too much time driving around retrieving supplies, so you might choose to better stock vans or predict what parts a specific job might need before the technician leaves the warehouse.
7. Customer Satisfaction
As you can imagine, customer satisfaction is a key part of understanding how good your service actually is and whether it’s meeting customer expectations.
This metric can be tricky to measure because it isn’t strictly quantitative. While you’ll want to gather numerical data, such as experience ratings out of 10, you’ll also want to collect information on what customers like and don’t like about your service — they might have insights you never would have considered.
One way to collect customer satisfaction data is to call them or have technicians collect a rating after performing the service. These options are somewhat labor-intensive, though. A more hands-off method of collecting data might be to use a customer portal. There, they can leave reviews whenever it works best for them, in just a few clicks.
Once you have the information, you can make specific changes according to the trends and insights you receive from your customers. These real-world influences are excellent for improving the quality of your work. If the number is high, you can even highlight it in marketing materials.
8. Call Volumes

Experiencing high call volumes often means one of two things — a spike in business or a high number of problems. While the call volume metric is a good one to track, you’ll need to add some nuance to make it actionable.
In either case, your agents might be overwhelmed. If call volumes are high for a good reason, you may just need to beef up your staff. If the numbers are high because of frequent issues, you might be able to reduce them through other means.
Revisit the “completeness” of jobs to make sure technicians are offering comprehensive service — they might need to spend more time on education, telling the client what happened, how to use their equipment and how to prevent the issue from happening again.
Another option is to create self-service options for your customers through a customer portal. By accessing documentation, site history and messaging tools, customers can solve more problems on their own and alleviate the demands on your call agents.
9. Employee Turnover
On the administrative side, employee turnover is a metric that reflects employee satisfaction. A high turnover rate could mean that your technicians have low morale or are frustrated with the job. This could come from many areas, like salary, work environment or excessive busywork, but the employee turnover metric gives you a good starting point to locate the core issue.
Undergoing high employee turnover can be costly. Estimates place the cost of replacing a worker to be about one third of the leaving worker’s annual earnings, and services industries are some of the hardest-hit by turnover.
If your turnover rate is high, take some time to assess why. Is the work environment too stressful for the pay? Is it fraught with inefficiencies and frustration? If you don’t give your employees the right tools for success, it could be affecting them negatively and tanking morale.
Ultimately, employees want to work for a company that allows them to do their work to the best of their abilities. Cultivate a streamlined, supportive environment by offering automation, such as smarter scheduling, easy invoicing and all of the information technicians need to get the job done, like site histories and warranty details.
10. Technician Utilization
On a similar note, technician utilization gauges the percentage of hours spent on billable activities, telling you whether employees are working efficiently. Overall, the more time technicians spend on tasks like paperwork and travel, the lower the number will be. Fixing it often involves streamlining your processes and using your management software to spot specifics.
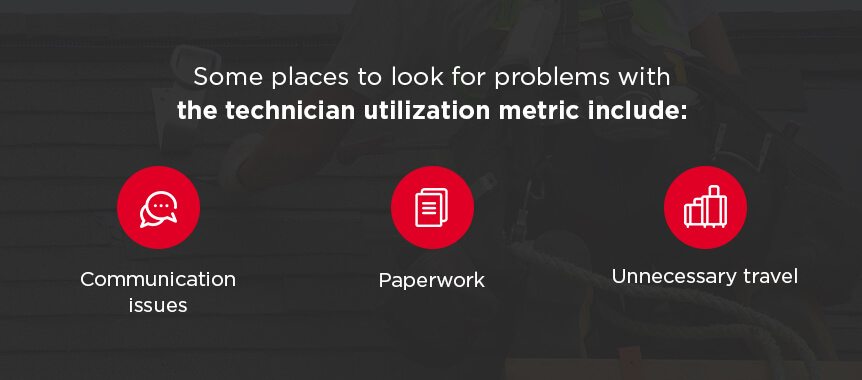
Some places to look for problems with the technician utilization metric include:
- Communication issues: Is poor communication causing errors or duplicate or unnecessary work? Consider improving communication with modern tools, like integrated messaging in your customer relationship management (CRM) platform and high visibility for contract management.
- Paperwork: Paperwork is necessary but not billable, so you’ll want to minimize time spent on it. Automating tasks like creating tickets, generating invoices and creating proposals can help you reduce time spent on paperwork.
- Unnecessary travel: Again, revisiting your approach to scheduling and preparation can help you limit unneeded travel.
11. Customer Acquisition Cost
Stepping into marketing, we can look to customer acquisition cost as a measure of your advertising strategies’ effectiveness. This metric refers to the amount spent on an advertising campaign divided by the number of jobs it brought in. This cost allows you to see the return on investment (ROI) for your various campaigns and understand what’s working.
If the number is high, you may want to tweak your strategies or even abandon the least-profitable ones. A great way to reduce acquisition costs is to use more targeted methods. Look through some of your repeat customers and satisfaction surveys and collect demographic information about their business, age, communication styles and more. Then, use the data to target similar people who are more likely to become customers.
12. Service-to-Cash Rate
Always remember that the longer it takes for a customer to pay you, the longer you have capital stuck in limbo. If your cash flow could use some work, track the service-to-cash rate. This metric measures how long it takes a customer to pay for a service from the time the service is completed. It mostly indicates the efficiency of internal processes, like the time it takes for a technician to document the details of the job and send the invoice.
To speed up these processes, you can automate data capture and invoice management. Consider a centralized management platform in which technicians can quickly capture data about the job while they’re on-site. Then, the invoicing system can pull information from the work order to generate an invoice to send to the customer. The whole process moves much more quickly and minimizes delays between job completion and invoicing.
You may also want to revisit your processes for following up on overdue payments. Better communication and reminders through a customer portal can help minimize the labor required to chase down payments.
Why Is It Important to Track Field Service Metrics?
Tracking metrics is essential for any successful, sustainable business. They act as a barometer for your company’s current standing and help you understand the whole picture. Whether you want to know how to improve or what you’re already doing right, metrics can help.
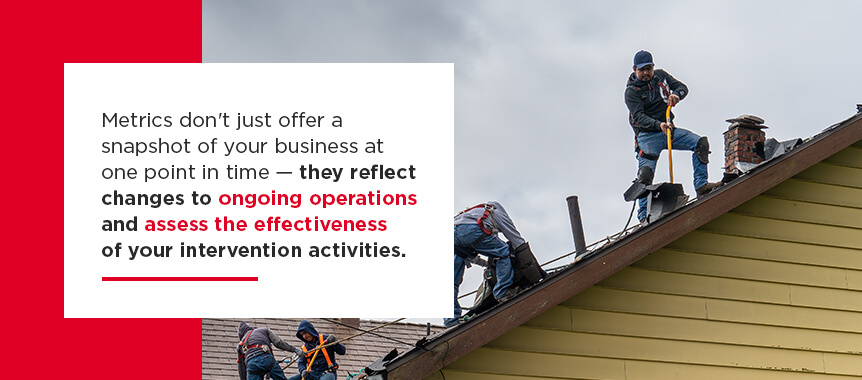
Metrics don’t just offer a snapshot of your business at one point in time — they reflect changes to ongoing operations and assess the effectiveness of your intervention activities. Say you decide to change your marketing strategy. The right metrics will show you whether that change is making the improvements you desire. If the numbers don’t change or worsen, you know you can go back to square one and try something else or look at a different metric.
Field service metrics cover more than in-service activities, too. As you’ve seen, they cover topics like administration, advertising, employee satisfaction and other elements of business performance to provide a comprehensive picture of your success.
For some small field services businesses, it might sound like an expensive or high-tech endeavor, but data-leveraging tools have become incredibly accessible and affordable, and data is one of the top trends in the industry today. Moving forward, it’ll be a key part of keeping pace with the competition and giving yourself an edge.
How to Track Field Service Metrics
There are a lot of metrics you could use, but if you want to track them efficiently and effectively, you’ll need to follow some best practices. Your field service metrics should be:
- Aligned: It takes time and resources to track and analyze your metrics, so you’ll want to make sure the ones you do track are carefully selected to help you meet your business goals.
- Actionable: Metrics should measure circumstances you can change. Tracking weather-related delays might give you some interesting numbers, but short of adding four-wheel drive to your fleet, you can’t fix the weather. On the other hand, you would be able to do something about delays from extra travel to retrieve supplies.
- Accessible: To track data, you need access to it. After all, you can’t track customer satisfaction if you don’t have a way to ask customers about their experiences.
A service management solution is a great way to track field service metrics. With a digitized operation, you can easily track KPIs in a variety of areas, from leads to invoicing to GPS movements. A CRM-focused platform can also add capabilities like a customer portal for collecting satisfaction surveys.
Service management solutions help you take action on those metrics. For example, the customer portal could offer self-service options to reduce your call volume, while in-field communication tools and document access could help reduce repeat visits due to inadequate technician skill.
How Tracking Field Service Metrics Can Help Your Business
Tracking metrics has no shortage of potential benefits. Depending on what you track and how you decide to improve them, you could:
- Boost profitability.
- Reduce travel time.
- Increase first-time fixes.
- Speed up the end-to-end completion process.
- Increase customer satisfaction.
- Boost the quality of your service.
That’s just the tip of the iceberg — metrics are what you make them. Remember, they’re your barometer of success and can help you get an at-a-glance view of progress toward your goals.
Metrics also point you in the right direction, zeroing in on which elements are affecting your success the most. A dashboard with business data can show you how the organization evolves from day to day, and historical data allows you to gauge developments over time.
If you’re working toward continuous improvement, metrics are non-negotiable. They’re one of your best tools for learning about your business and making valuable changes backed by the numbers.

Start Tracking Field Service KPIs With Dataforma
For an all-in-one platform that helps you track and improve upon your field service metrics and KPIs, choose Dataforma. Dataforma includes a CRM, service management, GPS tracking, time clocking and other tools for comprehensive field service management. Gain visibility and flexibility to help you meet business goals with an array of features for streamlining and optimizing your field service operations.
Dataforma was built by contractors, for contractors, with specialized tools designed for field service professionals. We know what it takes to run these businesses, so we outfitted Dataforma with the necessary resources. Explore the list of Dataforma features online, or reach out to us for a free demo to see how Dataforma can help you track and improve upon your metrics.